
Power BI Desktop gets updated once a month, and every month I keep my fingers crossed, hoping for items on my wishlist to be added, mainly the ability to save filters which I cannot understand how it can be missing from one of the market leaders product. Seems like I’ll need to keep my fingers crossed for another month, but it’s not a disappointing release at all.
The biggest news as far as I’m concerned are the “what-if” parameters. It’s a simple way to let the user play with parameters and see how his selections change existing data. So, for example we can let our customers see how a sales report would look like if prices go up by X percent, where X is a parameter for the report user to play with, and try different values. Before this release, this could still be achieved by creating DAX parameter tables or creating parameter tables in the database, but it’s heaps easier with the new feature.
Other notable features are:
- conditional formatting of font colours, in addition to the background option which has been there for a long time.
- In Matrixes, show values on rows instead of columns.
- New quick measure: weighted average.
- Google BigQuery connector
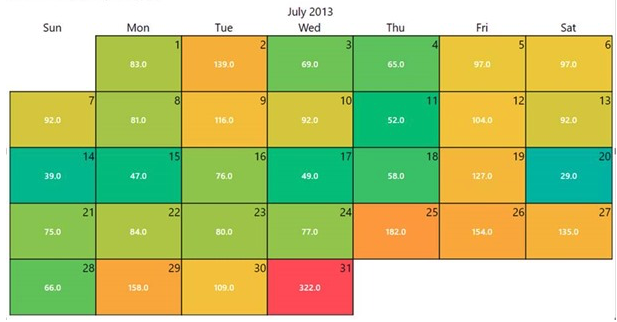
While these are not officially part of the release, there are some effective new customer visuals as well. I find the “Power KPI” and the “Beyondsoft calendar” to be great, especially the later, which allows a calendar view of KPIs:
Here’s a video from Microsoft, describing and demonstrating all changes this month: